Power BI Performance Optimization. Part 3: DAX Optimization
Twelve DAX best practices for Power BI: row vs filter context, measures over calculated columns, variables, DIVIDE, SUMMARIZECOLUMNS, TREATAS and what to avoid.

Founder · MCT · Editor of the official DP-600 book
En resumen
Twelve DAX practices that cut query time in Power BI, ordered by impact. The biggest wins come from understanding row context versus filter context, writing measures instead of calculated columns, and replacing the functions that force the engine to scan when it does not have to.
- Measures over calculated columns: calculated columns are materialised and stored in the model; measures are evaluated at query time and cost no memory.
- Swap the expensive functions:
DIVIDEinstead of the/operator,SUMMARIZECOLUMNSinstead ofSUMMARIZE,COUNTROWSinstead ofCOUNT, andSELECTEDVALUEinstead ofHASONEVALUEplusVALUES. TREATASfor virtual relationships: apply a filter across tables without adding a physical relationship to the model.- Avoid
FILTERinside aggregations and nestedIF: both force row-by-row evaluation that the engine could otherwise fold. - Measure before and after with DAX Studio and Performance Analyzer: without a baseline there is no optimisation, only rewriting.
This third article will cover best practices to optimize the DAX Formulas of your data model.
1. Understand Row Context vs. Filter Context
DAX operates in two primary contexts: Row Context and Filter Context and understanding these concepts is essential for writing accurate and optimized formulas as misinterpreting these contexts can result in incorrect results or performance bottlenecks.
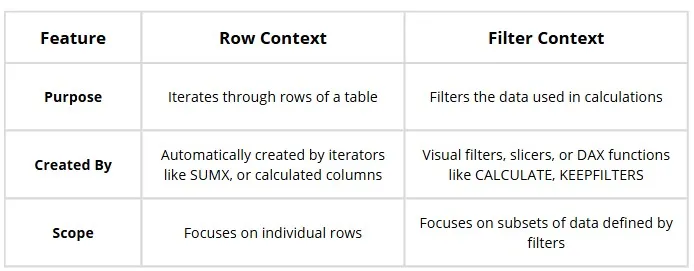
Row Context operates on one row at a time, it evaluates expressions like Sales[Quantity] * Sales[Price] within the current row. It is commonly created by:
-
Calculated Columns: When defining a column in a table, DAX evaluates the formula for each row.
-
Iterators: Functions like
SUMX,AVERAGEX,ADDCOLUMNS, and others iterate over a table, creating a row context for each row processed.
Unlike filter context, row context does not inherently filter data; it focuses on the specific row being processed. The entire row is available in the context, even if only specific columns are used in the expression.
Filter Context is applied to the data before any calculation occurs. It is determined by:
-
Visual Filters: Slicers, cross-filtering, or selections in visuals.
-
Explicit Filters in DAX: Functions like
CALCULATE,REMOVEFILTERS, andKEEPFILTERSmodify the filter context programmatically.
Filter context determines which rows of data are visible and included in calculations. Each cell in a visual, like a matrix or chart, is calculated within its unique filter context and affects which rows are processed, while row context evaluates expressions on individual rows.
Key Differences
2. Use Measures Instead of Calculated Columns
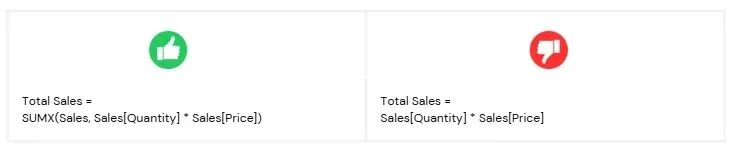
Calculated columns are precomputed and stored in your data model, increasing the size of the model and potentially impacting performance. Instead, use measures for dynamic calculations, as they are computed on demand and do not bloat your data model.
3. Use Variables for Readability and Performance
Variables improve the readability and maintainability of your DAX formulas by breaking them into smaller, logical steps. They also enhance performance because variables are computed only once, even if referenced multiple times in the same calculation. 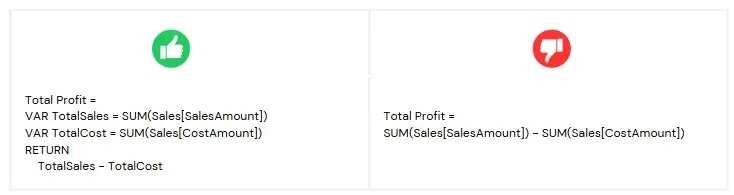
4. Avoid Forcing Zero Values in Measures With No Data
In Power BI, forcing measures with no data to display as zero might seem like a harmless approach to improve readability, but it can significantly degrade performance. When this logic is applied, Power BI unnecessarily recalculates the measure for every row, significantly increasing processing time and memory usage. Instead of forcing zeros, consider leaving measures blank for missing data to avoid unnecessary calculations and handle missing data visually through formatting or narrative explanations.
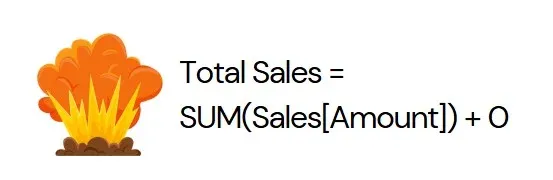
⚠️ Warning: This practice on large datasets can result in significant performance degradation, turning efficient reports into resource-intensive nightmares. 💥
5. Avoid Excessive Use of IFERROR or ISERROR
Functions like IFERROR or ISERROR in DAX can significantly degrade calculation performance by increasing the number of storage engine scans. Instead implement defensive strategies to handle errors proactively.
Best practices
-
Replace or filter invalid data and ensure correct data types in Power Query.
-
Disable the
Is Nullableproperty on columns to prevent incomplete data during refresh. -
Replace
IFERRORwithIFto check conditions directly. While it may cause minor performance impact, it avoids raising errors and performs better:
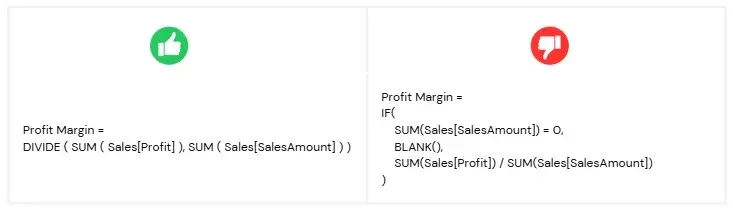
Profit Margin =
IF(SUM(Sales[SalesAmount]) = 0, BLANK(), SUM(Sales[Profit]) / SUM(Sales[SalesAmount]))
- Use Error-Tolerant Functions: These functions are optimized to handle potential errors as allow you to enter an alternate result that would be returned instead.
6. Use DIVIDE instead divide operator (/)
Replace manual division calculations with the DIVIDE function, which is faster and handles errors gracefully (e.g., divisions by zero or blanks).
7. Use SUMMARIZECOLUMNS Instead of SUMMARIZE
When summarizing data for custom tables, prefer SUMMARIZECOLUMNS, as it is more performant than SUMMARIZE. SUMMARIZE handles both row and filter context, while SUMMARIZECOLUMNS only handles filter context.
8. Minimize the Use of FILTER in Calculations
The FILTER function is powerful but computationally expensive, as it evaluates conditions row by row. When possible, simplify filters by using natural relationships in your data model or predefined columns and use it in cases where complex filtering is required.
Best Practices
- Use boolean expressions for simplicity as they are optimized for performance and in-memory storage.
USA Sales =
CALCULATE ( [Sales], KEEPFILTERS ( ‘Geography’[Country] = “United States” ) )
- Use FILTER only for complex logic, like filtering with measures, multiple columns, or logical operators (OR, ||).
Sales for Profitable Products =
CALCULATE ([Sales],
FILTER ( VALUES ( ‘Product’[ProductName] ), [Profit] > 0 )
)
- Preserve Filters with KEEPFILTERS to add filters without overwriting existing ones
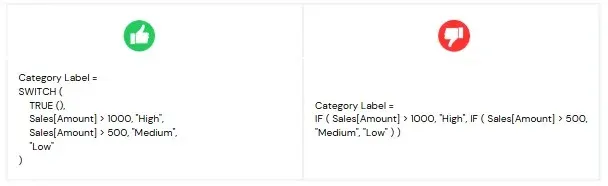
9. Avoid Nested IF Statements
Nested IF statements can make your DAX code complex, harder to read, and more difficult to maintain. Instead, use the SWITCH function for scenarios with multiple conditions. SWITCH improves readability, simplifies logic, and enhances maintainability while offering comparable performance.
10. Use TREATAS for Virtual Relationships:
Use TREATAS to apply filters from a table expression to columns in unrelated tables efficiently. This is particularly useful when no relationship exists between the tables.
Best Practices:
-
Use TREATAS instead of defining relationships for one-off calculations.
-
Consider USERELATIONSHIP for scenarios with multiple relationships.
-
Avoid using TREATAS in DirectQuery mode for calculated columns or Row-Level Security (RLS).
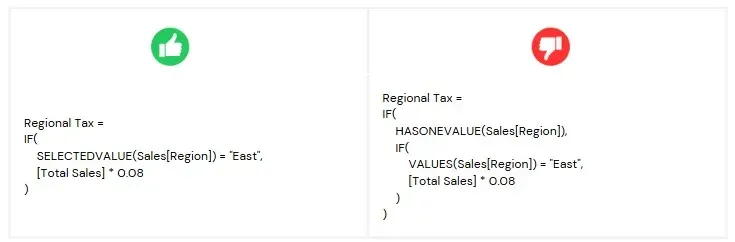
11. Use SELECTEDVALUE instead of HASONEVALUE and VALUES
When testing if a column is filtered by a specific value, use the SELECTEDVALUE function instead of the older pattern involving IF, HASONEVALUE, and VALUES. SELECTEDVALUE is more efficient, concise, and easier to read.
12. Use COUNTROWS Instead of COUNT
When counting rows in a table, COUNTROWS is a better choice than COUNT. While both can give the same result when counting non-blank values, COUNTROWS is more efficient and performs better, especially with large datasets and handles BLANKs better.
Which Tools Help You Measure DAX Performance?
Performance Analyzer
Analyze the performance of your report elements, such as visuals and DAX formulas when users interact with them, and provides information on which consume the most resources.
Steps to use Performance Analyzer
-
Go to the Optimize ribbon in Power BI Desktop.
-
Click on Performance Analyzer to open the pane.

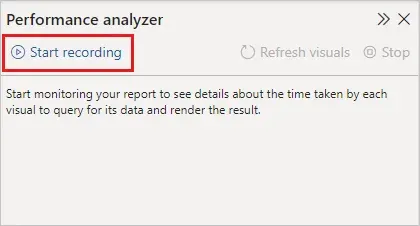
- Click Start Recording to begin capturing the performance of your visuals.
-
Interact with your report or click Refresh visuals to record the load times.
-
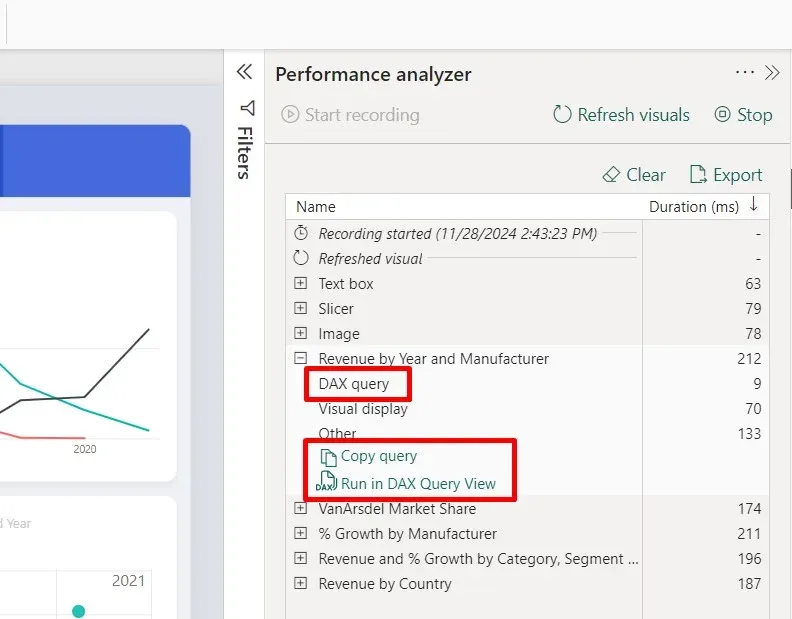
Analyze Results, after interactions, you’ll see a breakdown of the time taken (duration) by each visual.
-
Optimize DAX queries with longest query times, for this click Copy Query to copy the DAX formula and troubleshoot it in DAX studio or run in DAX query view, where you can write and execute the DAX queries directly against semantic models.
Conclusion
By following these best practices, you can write efficient, maintainable, and scalable DAX formulas in Power BI. Regularly review and refactor your DAX code to ensure it aligns with these guidelines, and always use tools like Performance Analyzer, DAX Studio and DAX query view to identify and resolve performance bottlenecks. And if you’d rather have an expert eye go over your model and measures, that’s exactly what our Power BI Clarity Check covers.
Published by